WordPress plugin for interactive 2D & 3D charts and diagrams in the Block Editor (Gutenberg)
Build interactive charts in WordPress – no code, right inside Gutenberg
Create interactive 2D and 3D charts directly in Gutenberg, with tooltips, zoom/rotate controls, CSV/JSON import, and a responsive layout.
For anyone who wants more than standard bar charts in WordPress: this plugin combines Gutenberg ease-of-use with interactive 2D/3D visuals for presentations, product storytelling, and data-heavy landing pages.
Interactive 2D & 3D charts plugin for WordPress
For landing pages, reports, and data-rich product pages.
✔ Gutenberg-native block
✔ 6 chart layouts in 2D or 3D
✔ CSV & JSON import
✔ Responsive & mobile-optimized
✔ 14-day money-back guarantee
Buy, download, and start using it in WordPress right away.
Native Gutenberg block · 14-day returns · Multilingual · Mobile-optimized
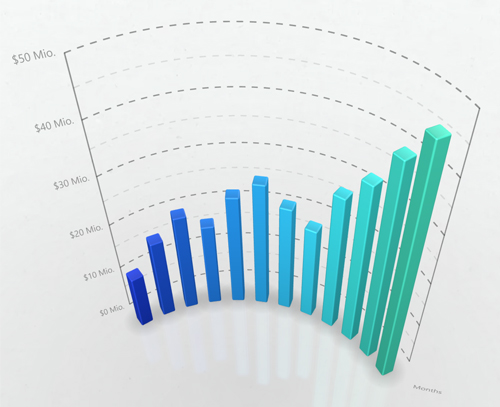
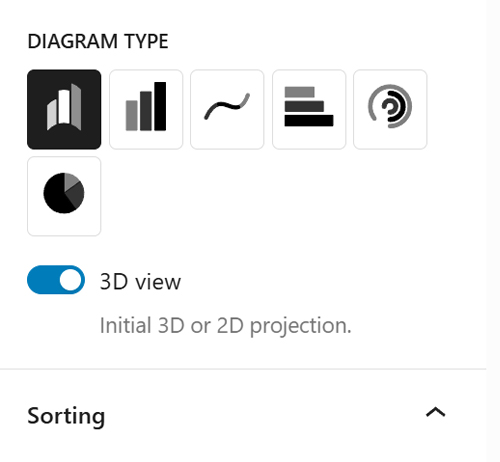
One dataset, six views – pick the chart style that best lands your message
Reuse the same data across Arc, Straight, Wave, Horizontal, Radial, or Pie layouts – in 2D or 3D depending on your goal. Backgrounds are configurable (including transparent), making your content clearer and more visually engaging.
From import to interaction: everything you need for charts that convince – right inside WordPress.
From importing and sorting data to tooltips, responsive behaviour, and performance – right inside the Block Editor.

2D & 3D view
Switch between a clear 2D view and an attention-grabbing 3D view depending on your use case.
Rotate & zoom
Interactive 3D controls for stronger engagement and better exploration of your data
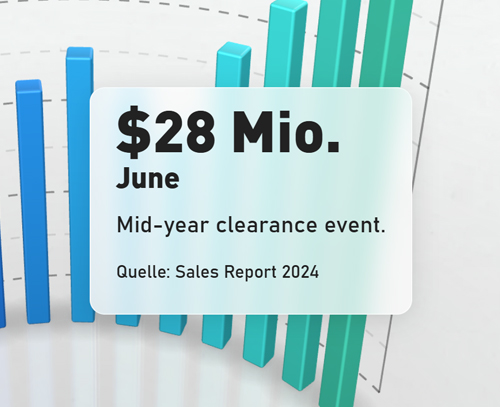
Hover tooltips
More context per data point – with tooltips for value, description, and source.
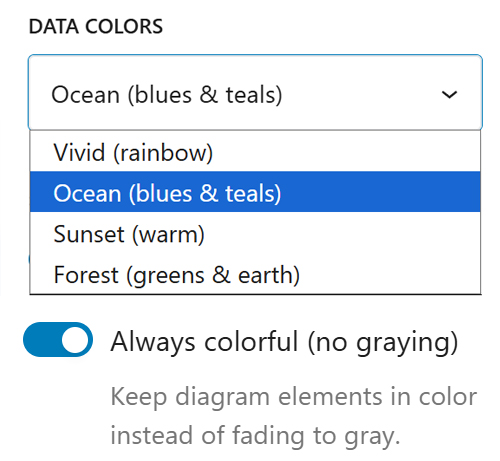
Four colour schemes + per-point colours
Match colours to your brand – via palettes or individual colours per data point.
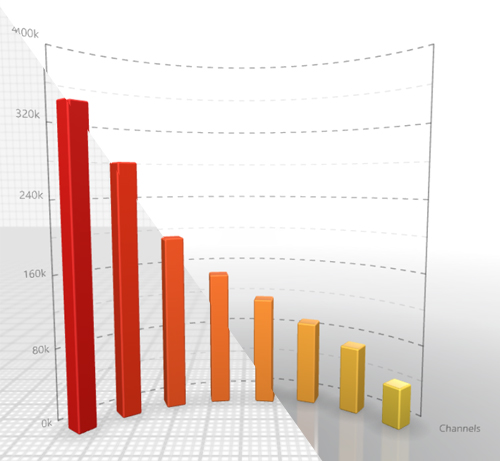
Two background styles
Choose a grid background with configurable line colour, or a reflective floor with gradient. Both can be fully transparent – ideal for custom page backgrounds.
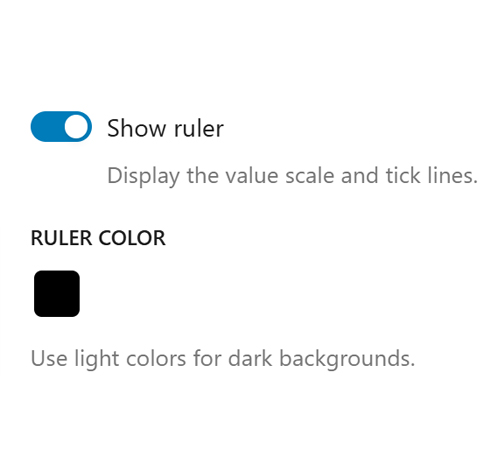
Configurable ruler
Toggle on/off with your own colour choice. Shows five scale steps on the Y axis and adapts automatically to Arc, Straight, and Horizontal layouts.
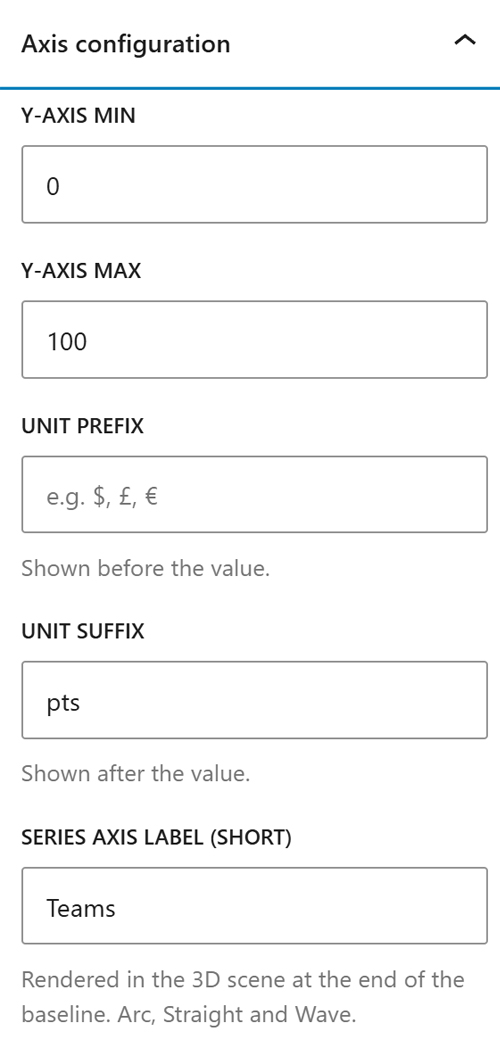
Configure the Y axis
Set min/max plus unit prefix/suffix freely – so values display correctly as “$10M”, “25%”, or “120°C”.
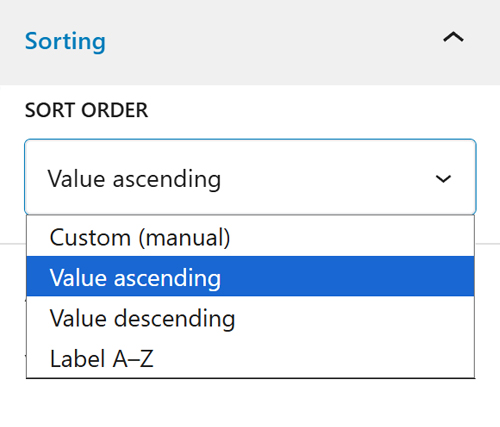
Sorting
Sort data points by custom order, by value (ascending/descending), or by label (A–Z).
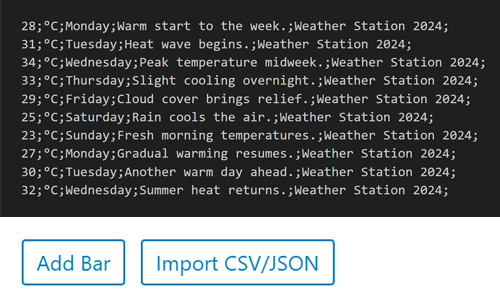
CSV & JSON import
Import data via CSV or JSON – no extra tools needed.
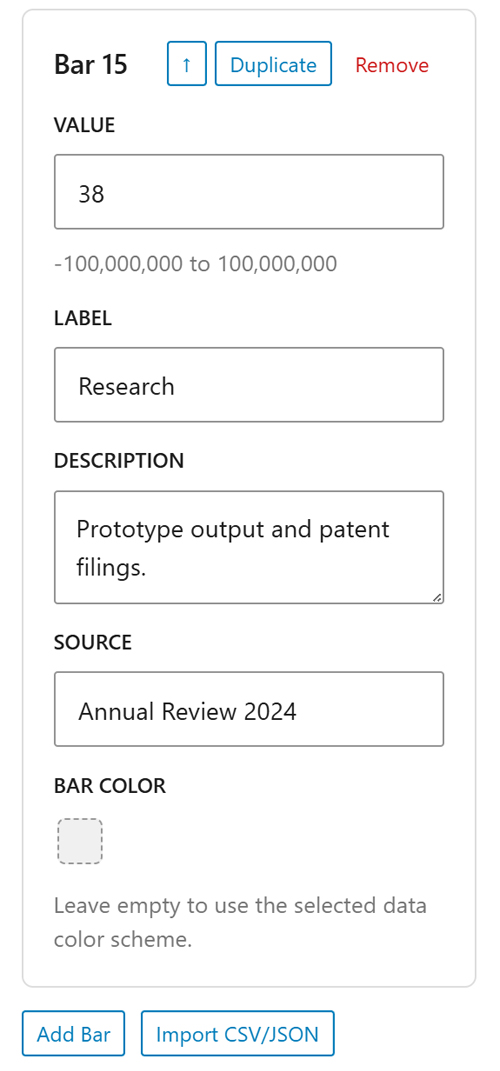
Manual data entry
Create, duplicate, sort, and edit up to 22 data points directly in Gutenberg – no code, no external tool.
Gutenberg-native & performance-optimized
No shortcodes, no page-builder add-on: this works as a native Gutenberg block with simple sidebar controls. With lazy loading, paused offscreen animations, and mobile optimisations, charts stay fast and responsive.
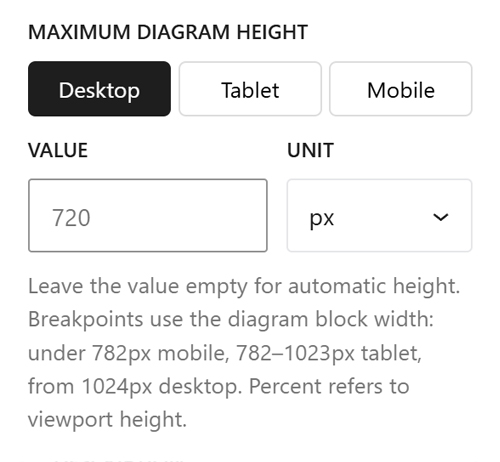
Responsive design
Set chart height separately for desktop, tablet, and mobile (px, em, or %). Tooltips, touch gestures, and rendering adjust automatically.
Pre-purchase FAQ – compatibility, data limits, mobile, performance
The plugin is a native Gutenberg block and works with tools built on the Block Editor (e.g., Spectra, Kadence Blocks, GenerateBlocks). Page builders that replace the Block Editor (Elementor, Divi, WPBakery) are not supported.
Yes – everything is configured directly in Gutenberg (layout, colours, data, background). No code required.
The block adapts to your content width and supports wide, full-width, and standard alignment.
Up to 22 data points per chart. From 20 data points, the editor shows a performance notice.
Yes – each chart loads only when it scrolls into view (lazy loading), keeping the page fast, even with multiple charts.
Yes – choose any background colour/style or set it fully transparent.
JSON (array or single object) and CSV (comma- or semicolon-separated). Paste via copy & paste or enter data manually.
Yes – touch gestures for rotation and zoom are supported, and rendering/resolution are optimised automatically for mobile performance.
Yes – per chart you can enable/disable rotate, zoom, and pan (e.g., for purely decorative visuals).
Around 15 charts per page typically work without issues. From ~16 charts, some devices/browsers may hit WebGL context loss; the plugin detects this and restores affected charts where possible.
Yes – min/max plus prefix (e.g., “$”) and suffix (e.g., “M”) are configurable.
Yes – when using percentages, the editor warns you automatically if the total exceeds 100%.